(time (dotimes [i 1000] (some #(when (> % 9999) %) (range 100000))))
"Elapsed time: 543.587147 msecs"

(time (dotimes [i 1000] (medley.core/find-first #(> % 9999) (range 100000))))
"Elapsed time: 112.694697 msecs"
March 16, 2022
Weekly Bits 06/2022 - CODE RED, Debugging on production, 'Dirty pipe' vulnerability, and macOS local snapshots
Table of Contents
Some of the interesting things I did, learned, or found in the past week.
CodeScene: CODE RED
CodeScene (the company I work for) published a game-changing whitepaper about the business impact of technical debt. Make sure to check it out, it can help you to convince your manager to pay more attention to code quality.
Clojure
Learn Reagent course
I keep going through the Learn Reagent video course, slowly.
A couple of interesting things in the past week:
Using cljs-ajax to load gigs from a remote URL
Using Google Firebase as "backend as a service"
CIDER 1.3 ("Ukraine")
A new cider version has been released.
[vemv on Slack]: It is good time to upgrade clj-refactor/refactor-nrepl as well! If you’re a fan of cljr-slash and Stuart Sierra’s aliasing guide, you are in luck: now it will offer completions for newly created namespaces, even if those haven’t been aliased elsewhere in the codebase.
clojure-mode 5.14.0 is out (first release in over a year)
clj-refactor.el 3.4.2 [it’s now 3.5.2 which should be finally stable] is out (bugfix release on top of yesterday’s release) (e
"find first"
experiment with some vs medley.core/find-first
You can notice that find-first is significantly faster,
easier to use and more readable.
medley.core.find-firstusesreduceandensure-reducedsee https://clojurians.slack.com/archives/C03S1KBA2/p1646805972575889
doall
It’s likely obvious to all Clojure programmers, but doall doesn’t apply to nested lazy seqs:
(time (def aa (doall {:a (range 10000000)})))
"Elapsed time: 0.207636 msecs"

(time (def aa (doall {:a (doall (range 10000000))})))
"Elapsed time: 6975.04873 msecs"
Talking :pre / :post conditions
There was a good discussion about pre-/post-conditions on Clojurians slack: https://clojurians.slack.com/archives/C03S1KBA2/p1646923165677949
OP asked about error-catching strategy - whether to catch AssertionError, Throwable, or disable assertions altogether.
Here’s what Alex Miller said about them:
asssertions are designed to be turned off in production
and should be invariants that indicate a serious error - basically these should only fail if the program is wrong, not if a user provides invalid input
pre/post is simultaneously under- and over-used. It’s under-used for true program invariants and over-used for input validation.
Java / JVM
Performance troubleshooting on production
I had a lot of fun with troubleshooting performance of our web application in a production environment. For that, I used a few tools which might come really handy.
Socket REPL is an incredibly useful tool for troubleshooting tricky issues. If it’s enabled, you can simply connect with netcat:
# to get slightly better experience, you can use rlwrap
nc localhost 5555
async-profiler - for running on aws VM see Running async profiler on AWS EC2 virtual machine #417
sudo /home/webapp/profiler/async-profiler-2.7-linux-x64/profiler.sh --all-user -d 110 -f /var/app/current/report-flamegraph.html 8847Notice how I use sudo and pass
--all-userto make it work.Also the async-profiler files should be owned by the user running the application.
pidstat
pidstat 1 -udr -h -p 8847jstat → see How to interpret jstat output?
sudo -u webapp jstat -gc -t 8847 1000
AWS & Cloud
Amazon EC2 instances and multiple IAM roles
You can attach only one role to an EC2 instance. Refer to the Amazon docs IAM roles for Amazon EC2
Therefore, create 2 managed policies and attach them to the same IAM Role.
Connect to your EC2 instance using SSH the modern way
This is (again) a great article from the Cloudonaut crew. It’s about how to combine EC2 Instance Connect and SSM Session manager to connect to your EC2 instances without using bastion hosts and exposing port 22.
I’ll write a separate blog post soon.
Security
'Dirty Pipe'
A new Linux vulnerability known as 'Dirty Pipe' allows local users to gain root privileges through publicly available exploits: https://www.bleepingcomputer.com/news/security/new-linux-bug-gives-root-on-all-major-distros-exploit-released/
Here’s a cool story about the history of the bug and interesting details about how pipes and zero-copy work: https://dirtypipe.cm4all.com/
MISC
macOS mysteriously eating disk space (aka "local snapshots")
I noticed, my Macbook was running low on the disk space so I decided to remove some old garbage.
To my surprise, even after deleting a few hundred gigabytes,
df -h still showed low disk space (basically the same stuff as before cleaning):
df -h
Filesystem                                                              Size   Used  Avail Capacity iused      ifree %iused  Mounted on
/dev/disk1s1                                                           932Gi  884Gi   24Gi    98% 7551906  249620200    3%   /System/Volumes/Data
...
Meet local snapshots
If you use Time Machine, local snapshots are taken automatically and stored on your local disk. They occupy disk space even after you delete files (so df -h won’t show you the "free" space you think you gained after you deleted the files):
tmutil listlocalsnapshots /
Snapshots for disk /:
com.apple.TimeMachine.2022-01-23-204702.local
This helped me to reclaim free disk space (after I simply deleted hundreds of gigabytes I still haven’t see any new free disk space via df -h)
sudo tmutil deletelocalsnapshots 2022-01-23-204702 (1)Notice that you need to omit the prefix "com.apple.TimeMachine" and the suffix ".local" when referencing the snapshot
After deleting the snapshot:
df -h
Filesystem                                                              Size   Used  Avail Capacity iused      ifree %iused  Mounted on
/dev/disk1s1                                                           932Gi  554Gi  353Gi    62% 7552912 3703759400    0%   /System/Volumes/Data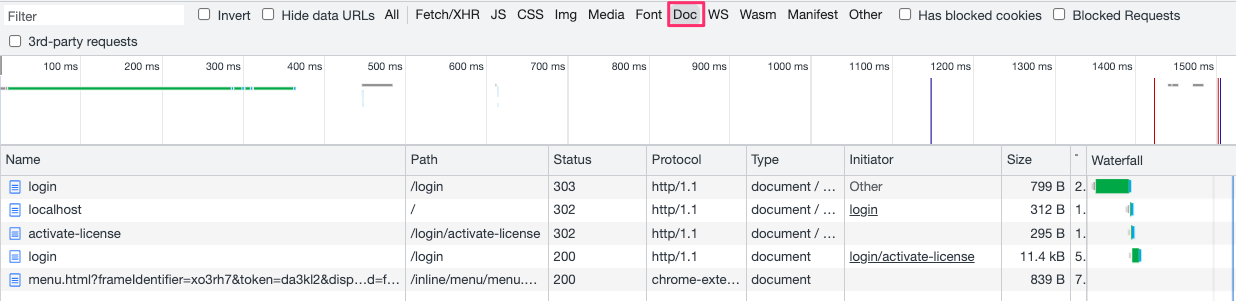
...Chrome DevTools - network requests filtering
If you, like me, use DevTools frequently to examine requests sent to the backend when developing web applications, you might have had problems with a big number of requests you have to slog through when searching for the right one: CSS files, images, JS requests, etc.
Often, I’m only interested in "full-page requests" and I finally found they can be filtered by selecting Doc in the Network tab:
Links
A quick recap of some of the links mentioned in this post: